In a different era, you would have learned about Didier Sornette’s work as a physicist by perusing the pages of selected academic journals. Sornette was trained as a geophysicist, and has had academic appointments at both French and US universities. So don’t be surprised to see several papers on those subjects posted on the website of a group he now heads at ETH Zurich.
What is head-turning is that he chairs a department devoted to analyzing entrepreneurial risks, as in financial bubbles. This eclectic research group has also taken on epileptic seizures, book sales on Amazon.com, and growth rates of social networks.
It’s not immediately obvious there are connections between any of the above. But Sornette has set up a bold agenda in his research, treating, say, the number of times Portlandia show up in tweets or blogs posts in the past few weeks–btw, according to Google Trends its rapidly trending upward–and quake patterns in Southern California as similar types of complex systems.

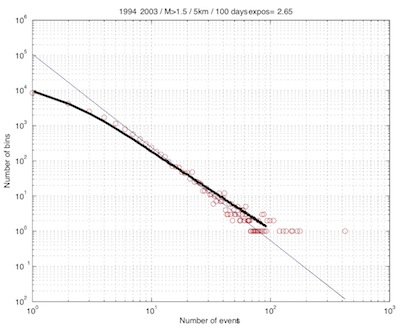
Distribution of earth quake events in Southern California in log-log format.
Sornette understands earthquake activity and “herding behavior in social networks” to follow underlying rules. In an article in Science Daily from 2004 he talks about divining the hidden laws behind sales patterns on Amazon.com.
Applying techniques from his seismology research, particularly a model intriguingly called Epidemic Type AfterShock Sequence or ETAS, he was able to show that book sales mirror the frequency patterns of quake aftershocks.
Said Sornette: “We have derived a law of how a sale’s shock to the system will jump up and decline over time. The books we analyzed behaved the same way. We can statistically predict how the system will evolve, how sales peaks can emerge, and we can predict the expected decline slope for books that rise sharply.”
The key to understanding the underlying generating mechanism behind quake patterns, sales of best sellers, or web site hits is suggested by the “epidemic” part of ETAS. Think of someone spreading a flu virus to their personal contacts, who in turn infects others, and on and on, creating a cascade of infections that grow on average exponentially.
Daily sales of bestsellers should in Sornette’s theory share a similar epidemic profile, with tweets and Facebook likes replacing viruses in terms of their influence on our preferences.
Back to earthquakes, where we are on more solid ground so to speak. They have been shown to have tree-like, branching behavior with a main quake directly generating child afterquakes that in turn spawn their own quake sub-branches. With a few seismology parameters, seismologists can calculate an average birth rate and other useful measures, from the total number of afterquakes generated to the time for a quake cascade to die out.
While simple to explain, these branching structures have, heavy sigh, a random aspect, which can lead to very complicated modeling. But Sornette and other so called socio-physicists and econo-physicists have successfully simulated these natural happenings and emboldened they’ve gone on to apply their models to other areas that have epidemic behaviors.
The important point is that the observable patterns are easy to understand and appreciate. In the chart above, you can see a graph of this earthquake data I took from one of Sornette’s papers. It shows the distribution of quake events over a 120 day period in grid blocks measured in 5×5 km areas. Plotted on log-log–that’s log as in logarithms–the distributions follow a nice straight line.

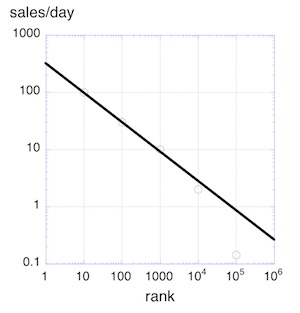
Distribution of Amazon book sales by rank, in log-log format.
To get a sense of what got these heavily nerd-credentialed scientists interested in everything from web statistics to terrorist incidents in Iraq, I’ve also taken a chart from Sornette’s paper on the “Dynamics of Book Sale: Endogenous verse Exogenous Shocks”.
He and his team scooped up daily ranking information from Amazon.com (using a service called JungleScan). Unfortunately, Amazon doesn’t reveal the daily sales volume stats of its books.
To solve that piece of the puzzle, they had to perform a little bit of guess work, basing their guesstimate on an author who knew the sales of his own book. Using that data and the known Amazon ranking of this book as a kind of anchor point, they were able to come up with sales numbers for other books.
They then graphed their results in high-schoolish log-log format. The straight line magically appeared from the data–the same as it did for the earthquakes. Scientists and students of logarithms know that straight line is a signature of something called a “power law”.
There’s nothing very complicated about that either. It’s just a way of saying the distribution of the number of events is, in math-speak, inversely proportional to, say the square or cube of event volume. So 2 quakes, are 1/4 as likely as 1 quake, three quakes are 1/9, etc. The same holds true for book sale rankings, but with a different power term.
I’ll have more to say on power laws, and some unusual and interesting time-based sales volume patterns in another post. The big hits and blockbuster books all turn out to display similar graphs that are intimately affected by our social networks and personal purchasing habits.

